Example Note
One line on what this is, in plain words.
Quick summary
- Short bullets.
- The one idea to remember.
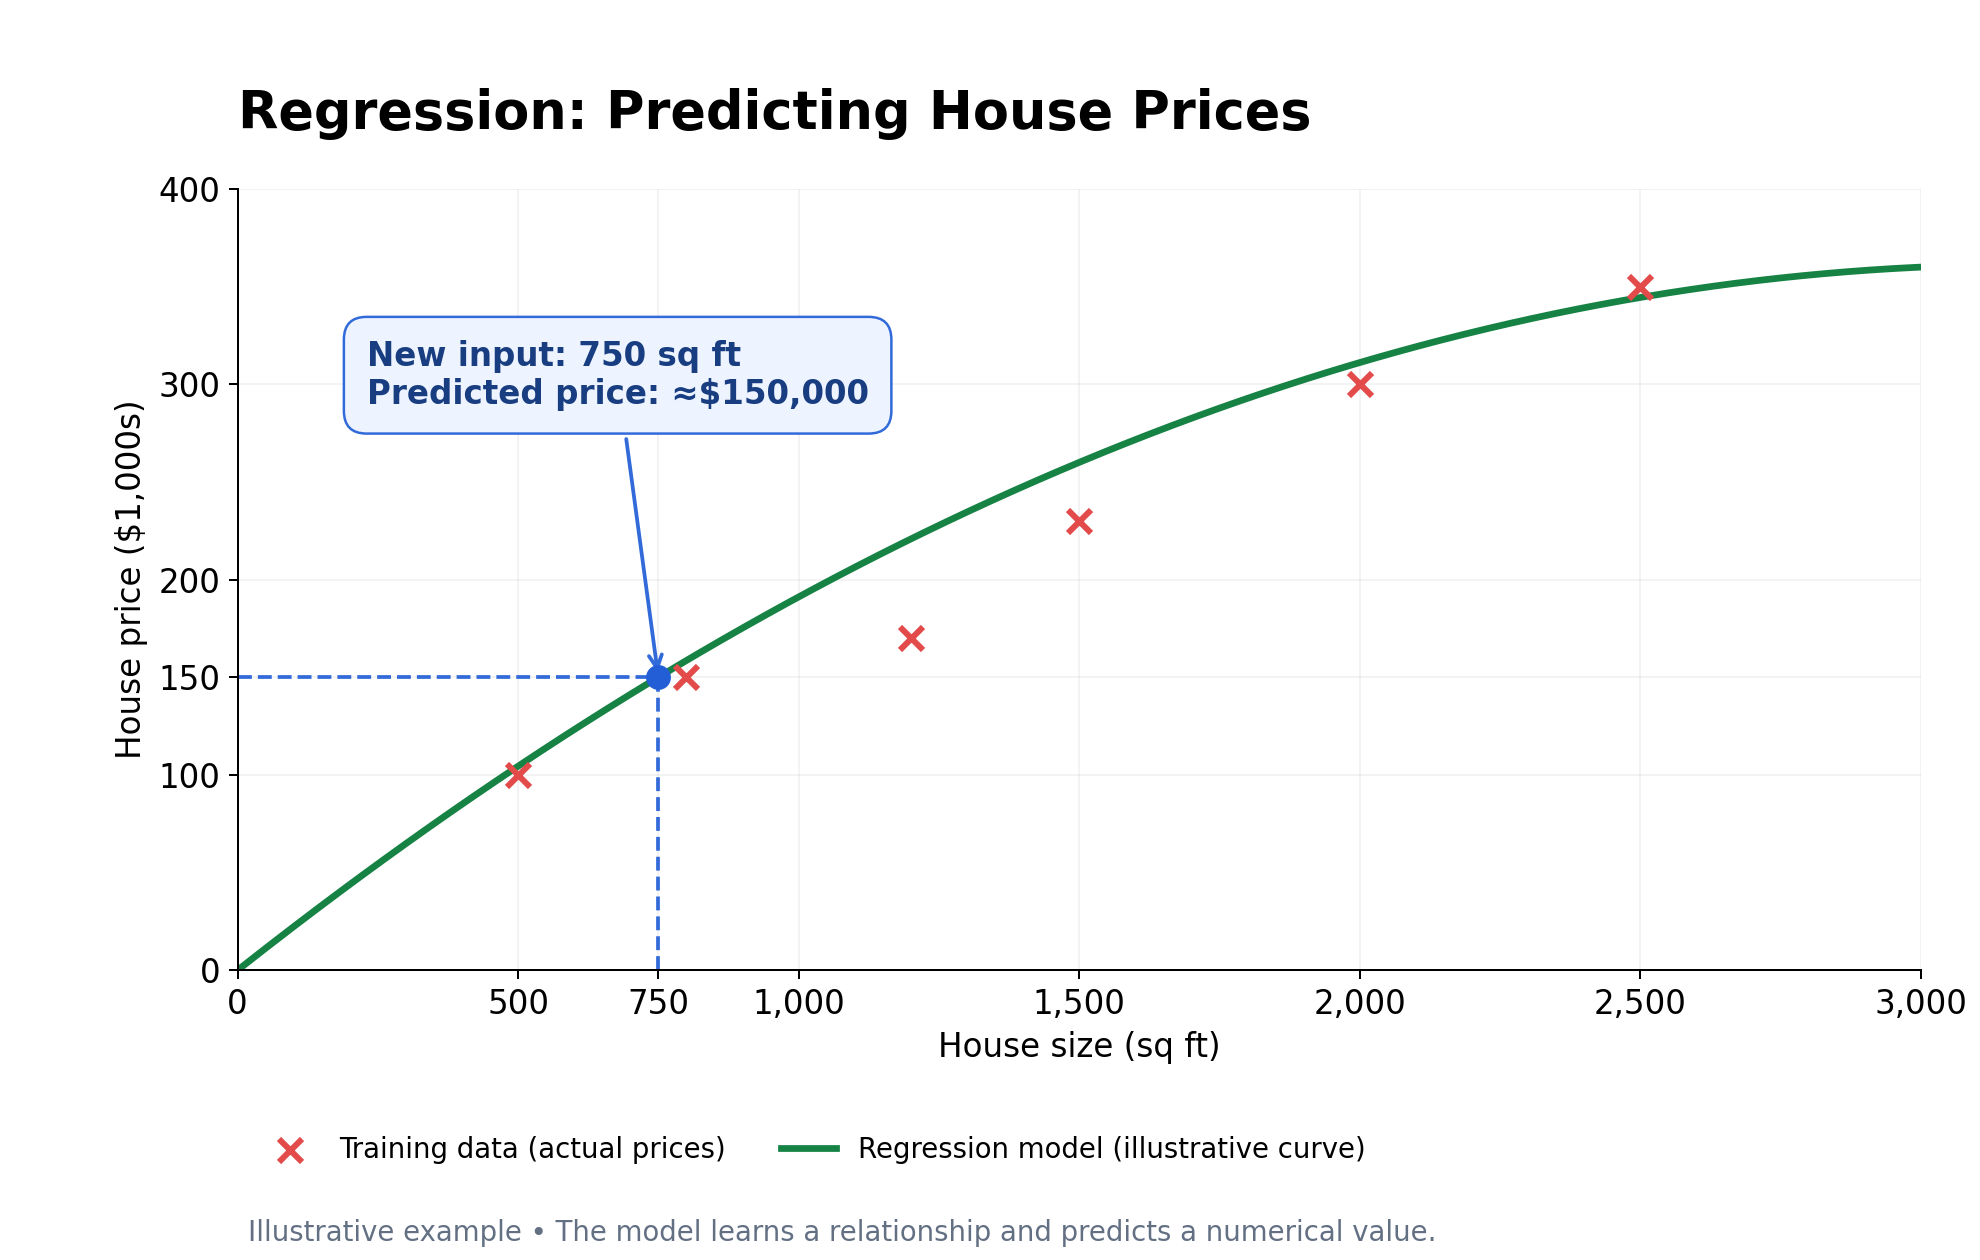
Table
| Size (sq ft) | Price ($1,000s) |
|---|---|
| 500 | 100 |
| 800 | 150 |
Math
The model predicts \(\hat{y}\) from \(x\). For one training example:
\[f_{w,b}(x^{(i)}) = w x^{(i)} + b\]Diagram
flowchart TB
    A["Training data"] --> B["Train model"] --> C["Predict new input"]
Runnable Python
Tap Run to try it. The first run takes a while because it downloads Python.
import numpy as np

sizes = np.array([500, 800, 1200, 1500, 2000, 2500])
prices = np.array([100, 150, 170, 230, 300, 350])

w, b = np.polyfit(sizes, prices, 1)
print(f"w = {w:.3f}, b = {b:.1f}")
print(f"Predicted price for 750 sq ft: ${w * 750 + b:.0f}K")
This block uses sizes, prices, w and b from the one above, so run that first:
import matplotlib.pyplot as plt

plt.scatter(sizes, prices, marker="x", color="red", label="Training data")
plt.plot(sizes, w * sizes + b, label="Model")
plt.xlabel("Size (sq ft)")
plt.ylabel("Price ($1,000s)")
plt.legend()
plt.show()
A normal, non-runnable code block:
docker restart thm-jekyll-local
Collapsible section
Tap to expand
| Term | Meaning |
|---|---|
| \(x\) | Input |
| \(y\) | Target |
Remember
- One bullet per thing worth remembering.
- Bold only the key term.